Test notebook for Pastas with PEST++ iES Solver
Packages
from pathlib import Path

import matplotlib.pyplot as plt
import pandas as pd
import pastas as ps
import pyemu

import pastas_plugins.pest as psp
/home/docs/checkouts/readthedocs.org/user_builds/pastas-plugins/envs/latest/lib/python3.11/site-packages/tqdm/auto.py:21: TqdmWarning: IProgress not found. Please update jupyter and ipywidgets. See https://ipywidgets.readthedocs.io/en/stable/user_install.html
Load Data
head = (
    pd.read_csv(
        "https://raw.githubusercontent.com/pastas/pastas/master/doc/examples/data/head_nb1.csv",
        index_col="date",
        parse_dates=True,
    ).squeeze()
).iloc[-300:]
prec = pd.read_csv(
    "https://raw.githubusercontent.com/pastas/pastas/master/doc/examples/data/rain_nb1.csv",
    index_col="date",
    parse_dates=True,
).squeeze()
evap = pd.read_csv(
    "https://raw.githubusercontent.com/pastas/pastas/master/doc/examples/data/evap_nb1.csv",
    index_col="date",
    parse_dates=True,
).squeeze()
pex = (prec - evap).dropna().rename("PrecipitationExcess")
Create Model
ml = ps.Model(head)
sm = ps.StressModel(
    pex, ps.Exponential(), name="pex", settings=ps.rcParams["timeseries"]["evap"]
)

ml.add_stressmodel(sm)
Solve with SciPy Least Squares
ml_ls = ml.copy()
ml_ls.name = "LeastSquares"
ml_ls.solve(solver=ps.LeastSquares())
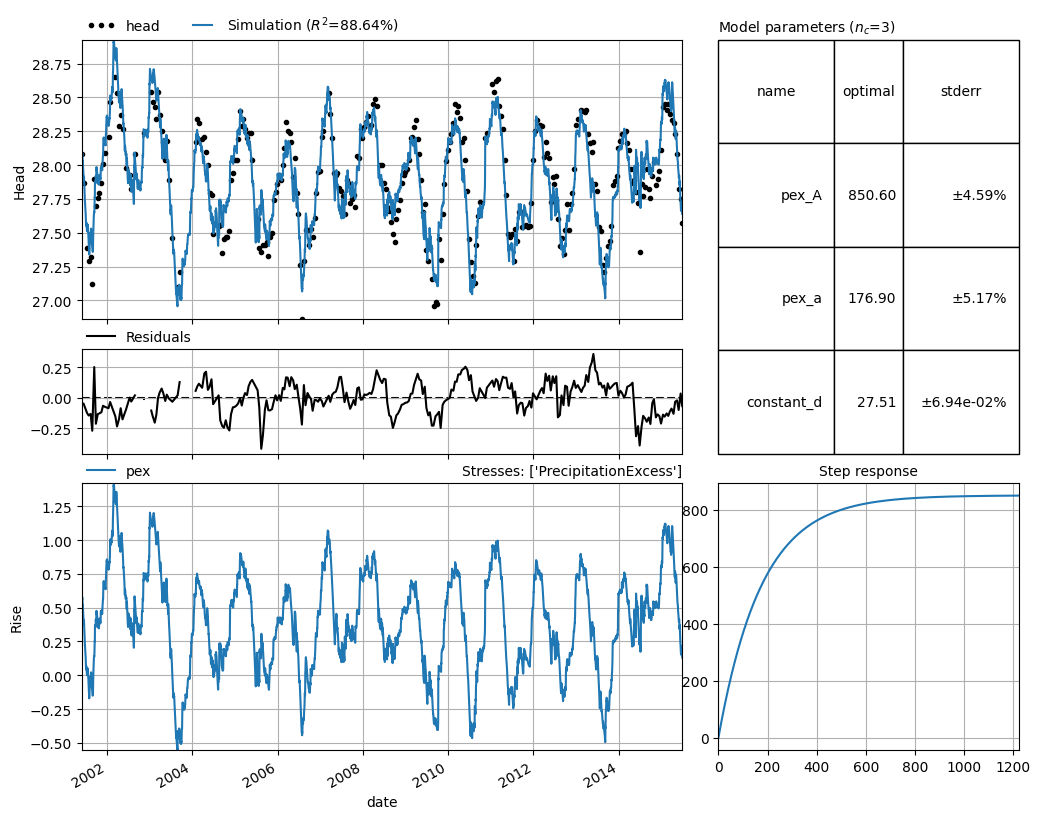
_ = ml_ls.plots.results(stderr=True)
Fit report LeastSquares             Fit Statistics
==================================================
nfev     26                     EVP          88.64
nobs     300                    R2            0.89
noise    False                  RMSE          0.13
tmin     2001-05-28 00:00:00    AICc      -1229.96
tmax     2015-06-28 00:00:00    BIC       -1218.93
freq     D                      Obj           2.44
freq_obs None                   ___
warmup   3650 days 00:00:00     Interp.         No
solver   LeastSquares           weights        Yes

Parameters (3 optimized)
==================================================
               optimal     initial  vary
pex_A       850.597021  215.674528  True
pex_a       176.902673   10.000000  True
constant_d   27.508927   27.902000  True
Pest-IES
ml_ies = ml.copy()
ml_ies.name = "PestIES"
solver = psp.PestIesSolver(
    exe_name="bin/pestpp-ies",
    model_ws=Path("pestf_ies/model"),
    temp_ws=Path("pestf_ies/temp"),
    # master_ws=Path("pestf_ies/master"),
    noptmax=5,
    ies_num_reals=31,
    port_number=4003,
)
# ml_ies.set_parameter("constant_d", initial=27.5, vary=False)
ml_ies.add_solver(solver)
ml_ies.solver.run_ensembles()
ml_ies.solver.nfev = solver.noptmax
ml_ies.solve(
    solver=solver, run_ensembles=False, report=False
)  # only sets the optimal parameters and stderr from ensembles run
/home/martin/repos/pyemu/pyemu/en.py:227: PyemuWarning: return type uncaught, losing Ensemble type, returning DataFrame
return type uncaught, losing Ensemble type, returning DataFrame
pst = pyemu.Pst(str(solver.master_ws / "pest.pst"))

pr_oe = (
    pyemu.ObservationEnsemble.from_csv(
        pst=pst, filename=solver.master_ws / "pest.0.obs.csv"
    )
    .transpose()
    .set_index(ml.observations().index)
)
pt_oe = (
    pyemu.ObservationEnsemble.from_csv(
        pst=pst, filename=solver.master_ws / f"pest.{ml_ies.solver.nfev}.obs.csv"
    )
    .transpose()
    .set_index(ml.observations().index)
)
noise = pyemu.ObservationEnsemble.from_csv(
    pst=pst, filename=solver.master_ws / "pest.obs+noise.csv"
)
pt_oe_sim = ml_ies.solver.simulation_ensemble(
    iteration=ml_ies.solver.nfev
)  # get simulated ensemble instead of observed ensemble
/home/martin/repos/pyemu/pyemu/en.py:227: PyemuWarning: return type uncaught, losing Ensemble type, returning DataFrame
return type uncaught, losing Ensemble type, returning DataFrame
/home/martin/repos/pyemu/pyemu/en.py:227: PyemuWarning: return type uncaught, losing Ensemble type, returning DataFrame
return type uncaught, losing Ensemble type, returning DataFrame
/home/martin/repos/pyemu/pyemu/en.py:227: PyemuWarning: return type uncaught, losing Ensemble type, returning DataFrame
return type uncaught, losing Ensemble type, returning DataFrame
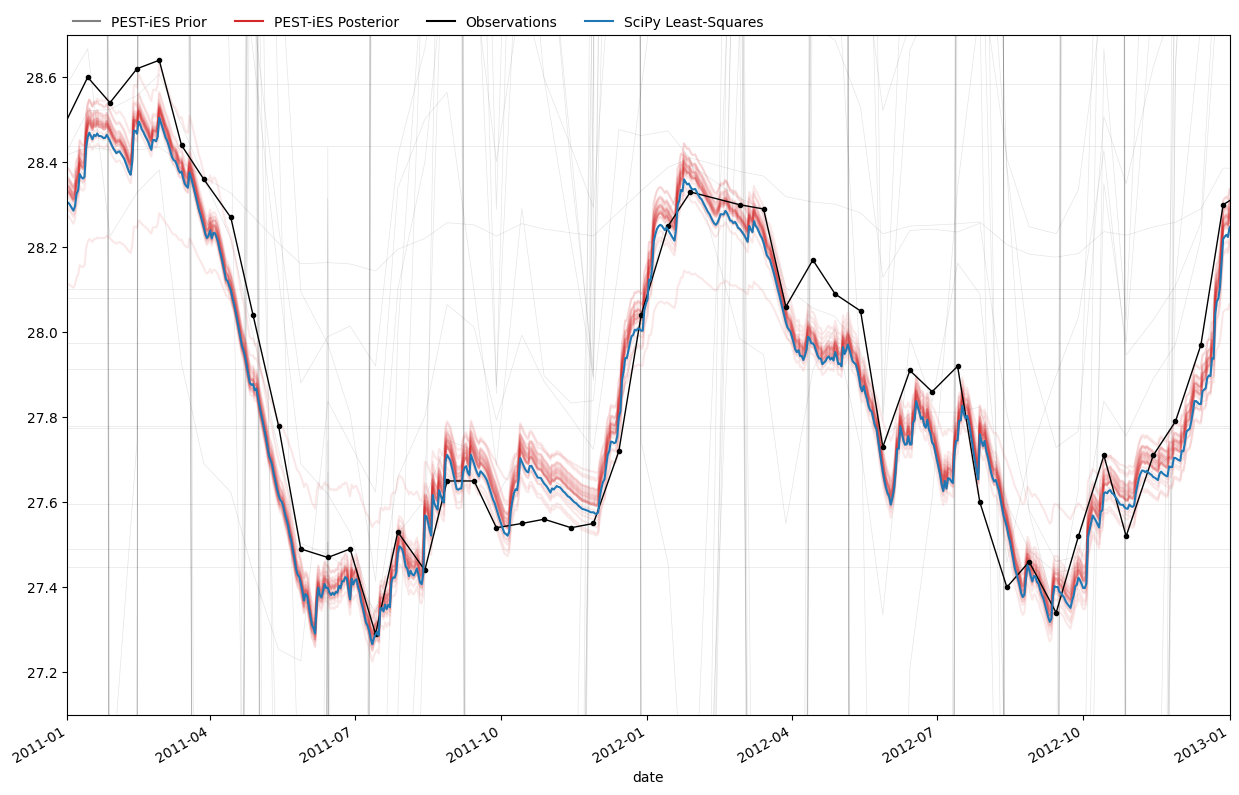
f, ax = plt.subplots(figsize=(15.0, 10.0))
pr_oe.plot(ax=ax, legend=False, linewidth=0.5, color="black", alpha=0.1)
# pt_oe.transpose().set_index(ml.observations().index).plot(ax=ax, legend=False, color="C1", alpha=0.1)
pt_oe_sim.plot(ax=ax, color="C3", alpha=0.1, legend=False)
ml.observations().plot(ax=ax, color="k", linewidth=1, marker=".")
ax.plot([], [], color="grey", alpha=1.0, label="PEST-iES Prior")
ax.plot([], [], color="C3", alpha=1.0, label="PEST-iES Posterior")
ax.plot([], [], color="k", alpha=1.0, label="Observations")
ml_ls.simulate().plot(ax=ax, color="C0", linestyle="-", label="SciPy Least-Squares")
# ax.set_ylim(ml.observations().min(), ml.observations().max())
ax.set_xlim(pd.Timestamp("2011"), pd.Timestamp("2013"))
ax.set_ylim(27.1, 28.7)
ax.grid(False)
labels, handles = ax.get_legend_handles_labels()
ax.legend(labels[-4:], handles[-4:], loc=(0, 1), ncol=4, frameon=False)
# f.savefig("pest-ies-obs-ensemble.png", dpi=300, bbox_inches="tight")
<matplotlib.legend.Legend at 0x7f9fd6b0cb90>
Compare
ps.plots.compare([ml_ies, ml_ls], figsize=(12.0, 8.0));
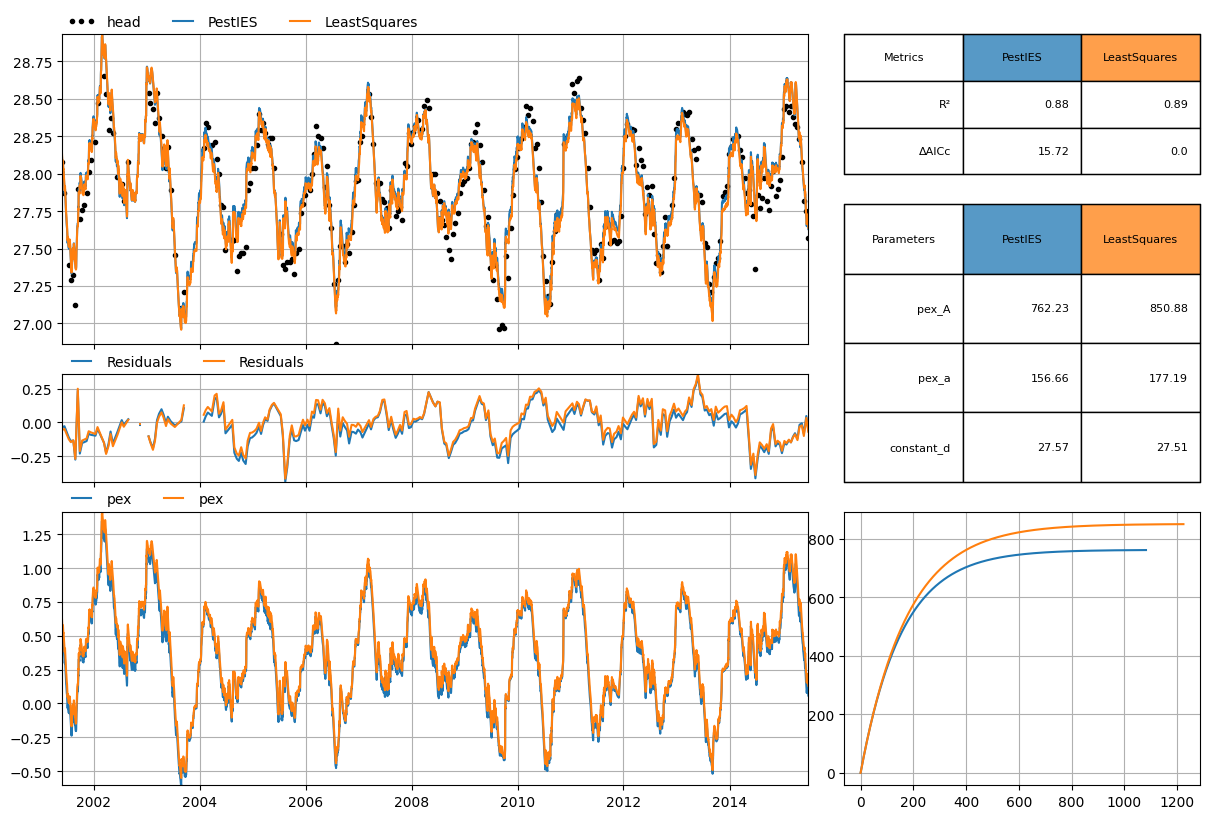
pd.concat(
    [ml_ies.stats.summary(), ml_ls.stats.summary()],
    axis=1,
    keys=[ml_ies.name, ml_ls.name],
)
| PestIES | LeastSquares | |
|---|---|---|
| Value | Value | |
| Statistic | ||
| rmse | 0.130822 | 0.127439 |
| sse | 5.134347 | 4.872243 |
| mae | 0.105119 | 0.103322 |
| nse | 0.880345 | 0.886453 |
| evp | 88.380677 | 88.645332 |
| rsq | 0.880345 | 0.886453 |
| kge | 0.906402 | 0.916928 |
| bic | -1203.237573 | -1218.957100 |
| aic | -1214.348920 | -1230.068448 |
| aicc | -1214.267839 | -1229.987367 |
pd.concat(
    [
        ml_ies.parameters.loc[:, ["optimal", "stderr"]],
        ml_ls.parameters.loc[:, ["optimal", "stderr"]],
    ],
    axis=1,
    keys=[ml_ies.name, ml_ls.name],
)
| PestIES | LeastSquares | |||
|---|---|---|---|---|
| optimal | stderr | optimal | stderr | |
| pex_A | 762.2320 | 21.037504 | 850.877791 | 39.066261 |
| pex_a | 156.6620 | 6.852751 | 177.192172 | 9.168906 |
| constant_d | 27.5714 | 0.009950 | 27.508810 | 0.019113 |