Linear Regression with PEST++ GLM
This notebooks is a small proof of concept / benchmark comparison between PEST and SciPy. It shows how to easily setup the PEST++ solver via pyeumu. The same setup is used for Pastas under the hood of the PestGlmSolver.
Packages
import shutil
from pathlib import Path

import matplotlib.pyplot as plt
import numpy as np
import pandas as pd
import pyemu
import scipy as sc
Create data
np.random.seed(pyemu.en.SEED)  # set seed

x = np.linspace(0.0, 1.0, 101)  # x coordinates
a = 1.0  # slope
b = 10.0  # y-intercept
y = a * x + b  # y coordinates
y_noise = y + np.random.normal(
    loc=0.0, scale=0.1, size=len(x)
)  # y coordinates with noise
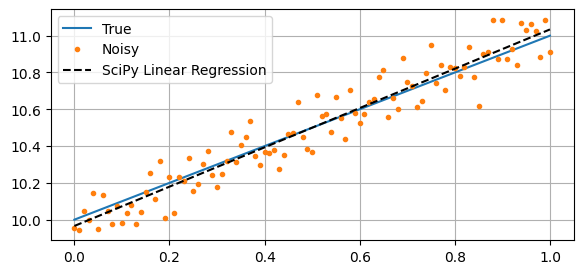
Scipy Linear Regression
res = sc.stats.linregress(x=x, y=y_noise)  # result object
a_fit = res.slope  # fitted slope
b_fit = res.intercept  # fitted y-intercept

# # add confidence interval
# dof = len(x) - 2 # degrees of freedom
# alpha = 0.05 # probability of confidence interval
# tinv = abs(sc.stats.distributions.t.ppf(alpha/2.0, dof)) # Two-sided inverse Students t-distribution
# a_fit_ci = tinv * res.stderr
# b_fit_ci = tinv * res.intercept_stderr
# lower_bound = (a_fit - a_fit_ci) * x + b_fit - b_fit_ci
# upper_bound = (a_fit + a_fit_ci) * x + b_fit + b_fit_ci

# visualize scipy result
fig, ax = plt.subplots(figsize=(6.75, 3.0))
ax.plot(x, y, label="True")
ax.plot(x, y_noise, marker=".", linestyle="", label="Noisy")
ax.plot(
    x, a_fit * x + b_fit, color="k", linestyle="--", label="SciPy Linear Regression"
)
# ax.fill_between(x, lower_bound, upper_bound, color="k", alpha=0.2, label=f"{1-alpha:0.0%} Confidence Interval")
ax.legend()
ax.grid()
Pest Linear Regression
Define run function
This function will be called each iteration by PEST++ GLM to create new simulated values.
def run():
    from numpy import linspace
    from pandas import Index, Series, read_csv

    parameters = read_csv("parameters_sel.csv", index_col=0)
    print("parameters view\n", parameters)
    # simulation = read_csv("simulation.csv")
    # x = simulation.index
    x = linspace(0.0, 1.0, 101)
    y = parameters.at["a", "optimal"] * x + parameters.at["b", "optimal"]
    simulation_new = Series(y, index=Index(x, name="x"), name="Simulation")
    simulation_new.to_csv("simulation.csv")
Setup PEST++ GLM files with Pyemu
# setup directories
model_dir = Path("model")
model_dir.mkdir() if not model_dir.exists() else None
temp_dir = Path("template")
temp_dir.mkdir() if not temp_dir.exists() else None
bin_dir = Path("bin")

# parameter bounds
bound = 10.0
a_ini = 0.8
b_ini = 0.2
parameters = pd.DataFrame(
    {
        "optimal": [a, b],
        "pmin": [a - bound, b - bound],
        "pmax": [a + bound, b + bound],
        "initial": [a_ini, b_ini],
    },
    index=pd.Index(["a", "b"], name="parnames"),
    dtype=float,
)
# setup files
par_sel = parameters.loc[:, ["optimal"]]
par_sel.to_csv(model_dir / "parameters_sel.csv")

observations = pd.Series(y_noise, index=pd.Index(x, name="x"), name="Observations")
observations.to_csv(model_dir / "simulation.csv")

# create pest optimization with pyemu
pf = pyemu.utils.PstFrom(original_d=model_dir, new_d=temp_dir, remove_existing=True)
# parameters
pf.add_parameters(
    "parameters_sel.csv",
    index_cols=[par_sel.index.name],
    use_cols=par_sel.columns.to_list(),
    par_type="grid",
    par_style="d",
)
# observations
pf.add_observations(
    "simulation.csv", index_cols=[observations.index.name], use_cols=[observations.name]
)
# python scripts to run
pf.add_py_function(file_name=run, call_str="run()", is_pre_cmd=None)
pf.mod_py_cmds.append("run()")

# create control file
pst = pf.build_pst()
pst.parameter_data.loc[:, ["parlbnd", "parubnd"]] = parameters.loc[
    :, ["pmin", "pmax"]
].values  # parameter bounds
pst.parameter_data["partrans"] = "none"  # parameter transformation not logarithmic
pst.control_data.noptmax = 100  # optimization runs
pst.write(pf.new_d / "pest.pst", version=2)

# execute
executable = "pestpp-glm"
shutil.copy(bin_dir / executable, temp_dir)
pyemu.os_utils.run(f"{executable} pest.pst", cwd=pf.new_d)

# get pets results
ipar = pd.read_csv(temp_dir / "pest.ipar", index_col=0).transpose()
a_pest, b_pest = ipar.iloc[:, -1].values
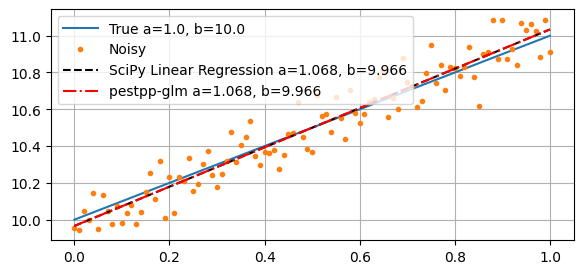
Compare result
fig, ax = plt.subplots(figsize=(6.75, 3))
ax.plot(x, y, label=f"True {a=}, {b=}")
ax.plot(x, y_noise, marker=".", linestyle="", label="Noisy")
ax.plot(
    x,
    a_fit * x + b_fit,
    color="k",
    linestyle="--",
    label=f"SciPy Linear Regression a={a_fit:0.3f}, b={b_fit:0.3f}",
)
ax.plot(
    x,
    a_pest * x + b_pest,
    color="r",
    linestyle="-.",
    label=f"{executable} a={a_pest:0.3f}, b={b_pest:0.3f}",
)
ax.legend(handlelength=2.5)
ax.grid(True)